

Mass spectrometric determination of acromelic acid
Journal of Chromatography A, 1055 (2004) 99–107
Mass spectrometric determination of acromelic acid A from a new
poisonous mushroom: Clitocybe amoenolens
J. Bessarda,∗, P. Saviucb, Y. Chane-Yenea,b, S. Monneta,b, G. Bessarda
a Laboratory of Pharmacology, Grenoble University Hospital, BP 217, 38043 Grenoble Cedex 9, France
b Clinical Toxicology, Grenoble University Hospital, BP 217, 38043 Grenoble Cedex 9, France
Received 28 January 2003; received in revised form 25 August 2004; accepted 25 August 2004
Abstract
As Clitocybe acromelalga, the mushroom Clitocybe amoenolens is responsible for erythermalgia. Acromelic acids isolated from C. acromelalga have been suspected to be to some extend the active principles. The objective was to develop a specific and sensitive liquid chromatographic–mass spectrometric method that would allow acromelic acid A identification and quantification in mushrooms. The method involved a single-step methanol–water extraction followed by a selective cleanup of the extract with solid-phase extraction cartridges (strong-anion exchange). The chromatographic separation was achieved on a porous graphitic carbon column with acetonitrile–water–formic acid as mobile phase. Detection was done with a mass analyzer equipped with a TurboIonSpray® source, operated in the negative ionization mode. Acromelic acid A concentration was determined in dried mushroom at around 325 ng/mg in C. amoenolens and 283 ng/mg in C. acromelalga. © 2004 Elsevier B.V. All rights reserved.
Keywords: Clitocybe amoenolens; Clitocybe acromelalga; Poisonous mushroom; Acromelic acids; Porous graphitic carbon; Erythermalgia; Solid-phase extraction
1. Introduction
In 1996, ingestion of mushrooms later identified as Clitocybe amoenolens Malençon [1] was recognised responsible for the onset of a very particular syndrome affecting five people in the French Savoie region [2]. First symptoms appeared more than 24 h after ingestion. Patients developed paresthesia of toes and fingers (tingling, prickling, pinprick and frostbite sensations) followed by paroxysmal burning pain lasting 2–3 h, notably at night. Pain crises were associated with a sensation of local heat, sometimes numbness, oedema and local erythema. Apart from those crises, skin aspect remained normal. Movements, warmth, contact and prolonged skin pressure increased symptoms, while they were relieved by cold water and, partially, by acetylsalicylic acid, morphine and clomipramine association. Symptoms resolved within 1–4 months. Polyneuropathy with vasomotor disturbances was suggested and erythermalgia (erythromelalgia) syndrome was recognised. Detailed pathophysiology of such syndrome is still unknown.
∗ Corresponding author. Tel.: +33 4 76 76 89 59; fax: +33 4 76 76 89 38. E-mail address: jbessard@chu-grenoble.fr (J. Bessard).
0021-9673/$ – see front matter © 2004 Elsevier B.V. All rights reserved. doi:10.1016/j.chroma.2004.08.133
Since the end of the XIXth century in Japan, the mushroom Clitocybe acromelalga Ichimura has been known to be responsible for a similar syndrome [3,4]. Several toxic substances, such as acromelic acids A–E, were isolated from this species during the 1980s [5–7]. Like domoic acid, they are members of the kainoid family, a group of non-proteinogenic pyrrolidine dicarboxylic acids (Fig. 1). Acromelic acid A exhibits neuroexcitatory activity, can bind glutamate receptors, mimics glutamic acid, causes characteristic behaviour changes and induces selective damages to the interneurones of the lower spinal cord in the rat. Acromelic acid A is the most powerful member of the natural kainic glutamate agonist family [8].
As Clitocybe acromelalga (C. acromelalga) and Clitocybe amoenolens (C. amoenolens) belong to the same taxonomic section [1],
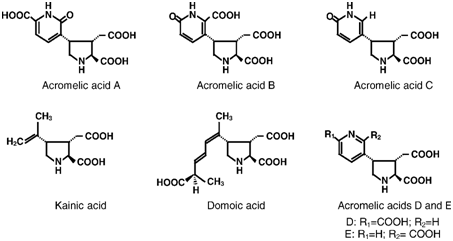
Fig. 1. Chemical structures of acromelic acids: A (C13H14N2O7), B (C13H14N2O7), C (C12H14N2O5), D and E (C13H14N2O6), kainic acid (C10H15NO4)
and domoic acid (C15H21NO6).
it was interesting to seek whether acromelic acids identified in the Japanese species could be found in the French species. As yet, acromelic acids A–E have been isolated from large amounts of C. acromelalga or alternatively synthesised, and then characterised by their NMR, UV, and IR spectra [5–7,9–14]. Their molecular formulas were determined by mass spectrometry (MS) [6,7,10,11,13,14]. Studies have been hindered by the limited availability of these products. A procedure that allows unequivocal and accurate determination of acromelic acids on a few milligrams of mushroom has not yet been reported.
The objective of this study was to develop a simple yet sensitive and specific method for identification and quantification of acromelic acid A, the most abundant and powerful kainoid amino acid isolated in C. acromelalga. This method involved chromatographic separation coupled with mass spectrometric detection. Characterisation and measure of acromelic acid A were conducted both in C. acromelalga and in C. amoenolens.
2. Experimental 2.1. Materials
Dr. K. Konno and Prof. K. Yokoyama (Shiga University, Otsu, Japan) kindly provided the synthetic acromelic acid A. Kainic acid and acetonitrile (HPLC grade) were purchased from Merck (Darmstadt, Germany). Methanol (for pesticide analysis) was obtained from SDS (Valdonne-Peypin, France). Formic acid (analytical grade) was provided by Prolabo (Paris, France). Deionized water was generated with an Elgastat UHQ PS filtration system (Elga Labwater, Le Plessis Robinson, France). Solid-phase extraction (SPE) was conducted on a Vac Elut vacuum manifold (Varian Sample Preparation Products, Harbor City, CA, USA). Strong anion exchange (SAX) cartridges (100 mg/10 mL) were purchased from International Sorbent Technology (Mid-Gladmorgan, UK). LC separations were performed on a Hypercarb® column (100mm x 2.1 mm, 5 m particle size) supplied by ThermoHypersil (Les Ulis, France). Preliminary studies were done with a Nova-Pak® C18 column (150mm x 2.1 mm, 4 m particle size; Waters, Saint Quentin, France) and with a PLRP-S column (250mm x 2.1 mm, 5 m particle size; Polymer Laboratories Amherst, MA, USA).
2.2. Mushroom samples
C. amoenolens was collected in 1998 at Lanslebourg, Savoie, France by Dr. P. Saviuc and identified by P.- A. Moreau (Geobotanische Institut, Z¨urich, Switzerland). C. acromelalga was collected in Japan by Dr. D. Guez (Interface Sc., Japan) and S. Miyauchi (Nagaoka University of Technology, Japan). Agaricus bisporus (A. bisporus) was purchased in a supermarket. Clitocybe gibba, Lepista gilva and Lepista inversa were collected in Savoie by Dr. P. Saviuc and P.-A. Moreau. All mushrooms were dried at 45°C, powdered in a grinder then dried again at 60°C until constant weight and finally stored desiccated in the dark at room temperature.
2.3. Calibration samples
Stock solutions containing acromelic or kainic acid (100 mg/L), used for validation samples, were prepared in methanol–water (50:50, v/v) and kept in the dark at —20 °C. Calibrator samples were prepared by fortifying 5 mg of dried powdered A. bisporus with acromelic acid A at concentrations: 10, 20, 50, 100, 200, 300 and 500 ng/mg. Quality control samples were similarly prepared at concentrations of 20 and 200 ng/mg.
2.4. Sample preparation
Calibrator or quality control samples, as C. amoenolens or C. acromelalga samples (5mg), were shaken in a 12 mL
|
J. Bessard et al. / J. Chromatogr. A 1055 (2004) 99–107 101 |
stoppered polypropylene tube with 3 mL of methanol–water (v/v) for 1 h in the dark, then centrifuged for 10min at 10,000 rpm. The supernatant was removed to a clean tube. A 2 mL volume of methanol–water (50:50, v/v) was added to the residue. The content was then mixed and centrifuged again. The supernatant was also removed and combined with the former for further purification by SPE on SAX cartridges.
After being positioned on the Vac Elut vacuum manifold, the SAX column was preconditioned successively with 2 mL methanol, 2 mL water and 2 mL methanol–water (50:50, v/v). Then, the methanol–water extract was poured into the cartridge reservoir and passed through the sorbent bed. The column was washed with 3 mL of methanol–water–acetonitrile (45:45:10, v/v/v) and eluted two-fold with 2 mL methanol–formic acid (97:3, v/v). The two eluates were combined and kainic acid, used as standard, was added (5 L of the stock solution). The eluate was evaporated under nitrogen flow at room temperature. The dry residue was dissolved in 50 L HPLC mobile phase and transferred to an autosampler vial fitted with a 200 L insert. Five microliters of the solution were injected.
2.5. LC–MS
The LC system consisted of two Perkin-Elmer series 200 pumps, equipped with a Perkin-Elmer series 200 autosampler (operated at 8 ◦C) and a Perkin-Elmer series 200 column oven (Perkin-Elmer, ¨Uberlingen, Germany). Chromatographic separation was performed with a Hypercarb® column maintained at 30 ◦C. The mobile phase consisted of phase A (water–formic acid, 99.5:0.5, v/v) and phase B (acetonitrile–formic acid, 99.5:0.5, v/v). The system was run in a linear gradient from 100% phase A to 80% phase A in 8 min then held at this level (phase A–phase B, 80:20, v/v) for 12 min. An equilibration time of 5 min at 100% phase A was allowed between two successive runs. The flow-rate was 200 L/min.
MS analyses were performed on an API 150 EX mass spectrometer (PE Sciex, Toronto, Ont., Canada) equipped with a TurboIonSpray® source. The API 150 EX was tuned for negative mode by direct infusion of a 10 mg/L solution of acromelic acid A in methanol–water (50:50, v/v) or water–acetonitrile–formic acid (94.5:5:0.5, v/v/v) at a flow-rate of 10 L/min. High-purity air was employed both as nebulizer gas and turbo heater gas; high-purity nitrogen was employed as curtain gas. The mass spectrometer was operated under the following conditions: electrospray voltage −4000 V; turbo heater gas flow-rate 7 L/min; turbo heater temperature 200 ◦C. Full scan mass spectra were acquired by scanning m/z 100–350 in negative mode. Quantitative analyses were performed in selected ion monitoring (SIM). Four ions were monitored: m/z 309 and 265 for acromelic acid A, m/z 212 and 168 for kainic acid. For each monitored ion, orifice voltage (OR) was set to −21 V and dwell time to 350 ms. Masschrom software was used for data acquisition and processing.
2.6. Statistical analysis
Data were expressed as mean ± standard error of the mean. Calibration graphs were calculated by linear regression (weighted “least squares” method; weight = 1/x). To assess the impact of different extraction conditions (methanol concentration or extraction time), linear regression was also used (“least squares” method); the null hypothesis was a linear curve slope equal to zero (Student’s t-test). S-plus 4.5 software (Mathsoft Inc.) was used for statistical analysis; values of P < 0.05 were considered significant.
3. Results and discussion
3.1. LC–MS acromelic acid A identification
The negative electrospray mass spectrum of acromelic acid at two orifice voltages is presented in Fig. 2a and b. At low orifice voltage (OR −21 V), the mass spectrum was characterised by a base peak at m/z 309, corresponding to the deprotonated molecular ion [M − H]− and a peak at m/z 265 corresponding to fragmentation (loss of CO2). At a higher orifice voltage (OR −61 V), additional fragment ions were observed at m/z 221 and 177 due to successive losses of CO2, and at m/z 247 and 203 corresponding to additional losses of H2O. Peak observed at m/z 331 and 347 might result from Na or K adducts. The observed fragmentations recall the ones reported by Quilliam for domoic acid [15].
Using a wide gradient for better separation, the chromatogram registered from C. amoenolens extract is presented in Fig. 3. To observe both the molecular ion with a good sensitivity and typical fragments, the orifice voltage was set to −26V. The peak at RT 23.9min had a mass spectrum similar to the one of acromelic acid A (base peak m/z 309, major fragment m/z 265, minor fragments m/z 221, 177 and m/z 247, 203). This peak was not observed on the chromatograms registered from A. bisporus extracts under the same conditions (Fig. 3). Thus, the presence of acromelic acid A in C. amoenolens is established.
3.2. Acromelic acid A quantification
The choice of an internal standard was not easy. The stable isotopically labelled acromelic acid A, the ideal standard, was not commercially available. Kainic acid, already used with success for the domoic acid determination [16], was tested. Since it does not share an entirely common structure with acromelic acid A (Fig. 1), we preferred to add it on the purified extract. Its negative electrospray mass spectrum (Fig. 2c and d) presented at low orifice voltage (OR −21 V) a base peak at m/z 212 corresponding to the deprotonated molecular ion [M − H]−. At a higher orifice voltage (OR −61 V), additional
|
102 J. Bessard et al. / J. Chromatogr. A 1055 (2004) 99–107 |

Fig. 2. Negative-ion ESI mass spectra of acromelic acid A (a and b; 500ng injected) and kainic acid (c and d; 100ng injected). Conditions: electrospray voltage —4000V; OR —21 V and OR —61 V; turbo heater temperature 200°C.
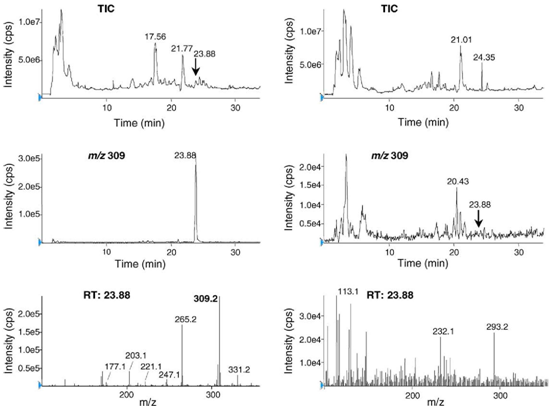
Fig. 3. Recording tracings of purified extracts of C. amoenolens (left pictures) and A. bisporus (right pictures). The upper pictures are LC–ESI-MS total-ion current (TIC) chromatograms; the middle pictures display chromatograms of ion m/z 309; the lower pictures are the corresponding mass spectra registered at RT 23.88 min. LC conditions: mobile phase A (water–formic acid, 99.5:0.5, v/v); mobile phase B (acetonitrile–formic acid, 99.5:0.5, v/v); gradient elution: 0–2min with B = 0%, 2–30min with B = 0–40%; flow-rate: 200 pL/min. MS conditions: electrospray voltage —4000V; OR —26V; turbo heater temperature 200°C.
J. Bessard et al. / J. Chromatogr. A 1055 (2004) 99–107 103
fragment ions were present at m/z 168 due to a loss of CO2, and at m/z 194 and 150 corresponding to additional losses of H2O.
Quantification was performed in SIM mode. The deprotonated molecular ions [M − H]− at m/z 309 for acromelic acid A and at m/z 212 for kainic acid were selected for quantification. The respective fragment ions at m/z 265 and 168 ([M − 1 − 44], loss of CO2) were used for confirmation. The orifice voltage was set to −21 V to get the best sensitivity.
3.3. Extraction-cleanup
Aqueous methanol extraction procedure has been often used for natural product extraction because it provides good recovery [17,18].
This extraction could be coupled with a suitable cleanup. Our purification procedure has been performed with a method derived from the selective cleanup of shellfish extracts containing neurotoxic amino acids such as domoic acid [16,18]. SAX sorbent phase is used to extract organic acidic compounds exhibiting a negative charge from both aqueous and non-aqueous matrixes. This is the reason why the aqueous methanol extract had not required any modification and was applied directly on the SAX cartridge. SAX phase maintains a permanent positive charge over the whole pH range (pH 1–14). The anionic analyte may be displaced from the sorbent with a high ionic strength buffer, with a more strongly-bound anion or with an acidic eluent that will disrupt the ionic bounding. The acidic elution mixture (methanol–formic acid, 97:3, v/v) was chosen due to its volatility that enables easy concentration.
In preliminary studies, aqueous methanol extractions were carried out with an extraction time of 3 hand a 50% methanol percentage; this solvent ratio was previously determined as the best for domoic acid extraction in mussels [18].
To optimize acromelic acid extraction, C. amoenolens samples were first extracted at the fixed 50% methanol percentage and different extraction times were tested (0.5, 1, 1.5, 2, 2.5 and 3 h). Two series were performed. The slopes of the linear regression curve (measured acromelic acid concentration versus time) and the correlation coefficients were not statistically different from zero (all P > 0.29). An extraction time of 1 h was retained for convenience. Then C. amoenolens samples were extracted at different methanol percentages (20, 40, 50, 60 and 80%). Two series were also performed. The slopes of the linear regression curve (measured acromelic acid concentration versus methanol percentage) and the correlation coefficients were not statistically different from zero (all P > 0.20). Thus, a 50% methanol percentage and an extraction time of 1 h were chosen.
3.4. LC separation
Preliminary study showed that acromelic acid A was poorly retained on Nova-Pak® C18 column (C18 bonded silica phase). To improve chromatographic separation, two other reverse-phase analytical columns were assessed:PLRPS column (polymeric phase) and Hypercarb® column (porous graphitic carbon [PGC] phase). Experiments were conducted with the same mobile phase composition (water–formic acid–acetonitrile 94.8:0.2:5, v/v/v). Results are presented in Fig. 4. If kainic acid was easily retained on the three columns (retention time was about 7 min), acromelic acid A was not or poorly retained on C18 silica and polymeric phases even with high aqueous or acidic percentages. Conversely, acromelic acid A was strongly retained on the PGC phase: its retention time became higher than the kainic acid one, and even higher than the analysis run time. With these conditions, the acromelic acid A retention time was longer than 20 min. To get reasonable analysis times with narrow peaks, LC was operated on the PGC column in a gradient mode.
Hypercarb® column presents a selectivity different from the one of conventional C18 bonded silica and polymeric phases [19]. On a reverse-phase, analyte retention is reduced as analyte polarity increases; conversely on PGC, retention increases as polarity increases due to charge-induced interactions of the polar analyte with the polarizable surface of graphite. The molecular area of the analyte in contact with the graphite surface is also a factor determining the strength of the interaction [19].
Thus, the presence of an aromatic ring and numerous polar functions in the structure of acromelic acid A (Fig. 1) could explain the higher acromelic acid retention.
3.5. Matrix features
In preliminary studies, investigations were done from water–methanol (50:50, v/v) samples spiked with acromelic acid A. To get a better approach, the mushroom matrix constituted of dried A. bisporus was tested. Fig. 5 shows specific ion chromatograms registered from extracts of blank and spiked mushroom at different acromelic acid A concentrations. Kainic acid and acromelic acid A were well separated: their mean retention times were, respectively, 7.9 and 13.1 min.
Analyses of blank samples of three non-toxic mushrooms, resembling C. amoenolens, were also performed (L. inversa, L. gilva and C. gibba). These matrixes were tested for interference at the retention time of acromelic acid A, using the same extraction procedure and chromatographic conditions. Lack of any interference was verified.
Following experiments were conducted on matrix constituted of the easily available A. bisporus.
Given the available quantity of synthetic acromelic acid A, analyses were limited and stability studies (freeze/thaw cycles . . .) were not possible.
3.6. LC–MS method parameters
3.6.1. Linearity
Measures provided reliable quantitative results: calibration curve plotting area ratio (acromelic acid A/kainic acid)
|
04 J. Bessard et al. / J. Chromatogr. A 1055 (2004) 99–107 |
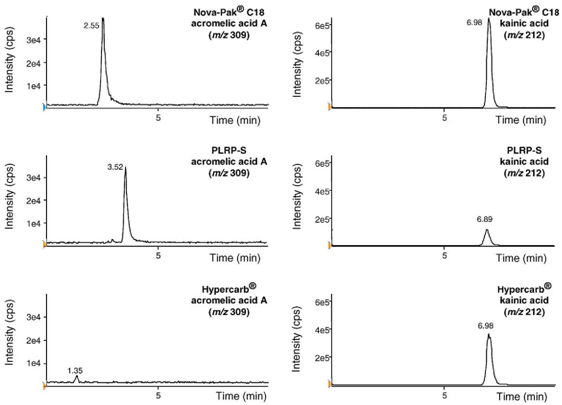
Fig. 4. Assessment of three columns (Nova-Pak® C18, PLRP-S and Hypercarb®) with the same mobile phase: water–formic acid–acetonitrile (94.8:0.2:5, v/v/v). Negative LC–ESI-MS chromatograms (SIM mode) were registered after injection of 50 ng of acromelic acid (left side, m/z 309) or kainic acid (right side, m/z 212). MS conditions for this preliminary study: electrospray voltage −4000 V; OR −46 V; turbospray gas: room temperature. Versus concentration ratio showed linear response within the working range (10–500 ng/mg). Equation of regression line and correlation coefficient (n = 6) were as follows: y = 0.145(±0.006)x−0.007(±0.002); r = 0.996(±0.003)
The observation of residuals showed an increase in variance with increase in concentration: a weighted least squares analysis was thus justified [20]. The intercept value was statistically different from 0 (P < 0.001). However, at each concentration level of the calibration curve, the accuracy (calculated / nominal concentrations) was determined within the 89–111% range.
The limit of detection (LOD) calculated for a signal-to-noise ratio of 3 (noise estimated near the analyte peak) was 1 ng/mg of dried mushroom. The lower limit of quantification (LLOQ) defined as “the lowest concentration which can be measured with acceptable precision and accuracy” [21] was set at the value of the lowest calibrator (10 ng/mg, relative standard deviation 15%, accuracy 106%).
3.6.2. Recovery
Recovery was defined as the ratio between the calibration curve slope of extracted acromelic acid A to the calibration curve slope of non-extracted acromelic acid A. Crude extracts of mushroom were not injected into the LC–MS system. Recovery (R) was estimated in two ways. First, ex traction recovery involved only the SPE purification step of methanol–water solution or A. bisporus extract spiked with acromelic acid A. The results were compared with those from direct injections of non-extracted acromelic acid A at the same concentration. Results were, respectively: R = 88% (n = 2) and 86% (n = 3). Second, total recovery was estimated after the whole extraction–purification process of spiked A. bisporus mushroom: R = 92% (n = 2). These findings led to think that the step of purification was the only limiting factor. Thus, the first step of methanol–water extraction was probably a complete process.
3.6.3. Within-, between-day precisions
Within-day precision was established from repeated analysis of A. bisporus mushroom spiked with acromelic acid A at concentrations of 20 and 200 ng/mg during one working day. Similarly, between-day precision was established for the same concentrations, one analysis being performed per day. Results are summarised in Table 1. Intra- and inter-assay precision and accuracy were acceptable. Relative standard deviation (R.S.D.) was less than 11%.
3.7. C. amoenolens and C. acromelalga results
Fig. 6 shows SIM chromatograms (m/z 309 and 265) registered from C. amoenolens and C. acromelalga extracts.
|
J. Bessard et al. / J. Chromatogr. A 1055 (2004) 99–107 105 |

Fig. 5. Negative LC–ESI-MS chromatograms (SIM mode) from extractedA. bisporus fortified with acromelic acid A. Acromelic acid A (m/z309) concentrations: (a) 0ng/mg (blank), (b) 20ng/mg and (c) 200 ng/mg. Kainic acid (m/z 212) concentrations: (d) 0ng/mg (blank) and (e) 100 ng/mg. Conditions: electrospray voltage −4000 V; OR −21 V; turbo heater temperature 200 ◦C.
|
Table 1 Within- and between-day precisions |
|
|
|
|
|
Acromelic acid A |
Acromelic acid A |
C. amoenolens (5 mga) |
|
Within-day |
|
|
|
|
Nominal concentration (ng/mg) |
20.0 |
200.0 |
Measured |
|
Mean concentration measured (ng/mg) |
19.8 |
195.3 |
314.3 |
|
Precision (R.S.D.b, %) |
2.7 |
3.6 |
11.8 |
|
Accuracyc % |
99.0 |
97.6 |
– |
|
nd |
6 |
6 |
8 |
|
Between-day |
|
|
|
|
Nominal concentration (ng/mg) |
20.0 |
200.0 |
Measured |
|
Mean concentration measured (ng/mg) |
19.5 |
211.0 |
340.2 |
|
Precision (R.S.D.b, %) |
10.5 |
7.0 |
16.8 |
|
Accuracyc (%) |
97.5 |
105.5 |
– |
|
nd |
6 |
6 |
6 |
a Dried mushroom.
b Relative standard deviation.
c Found/nominal × 100.
d Number of determinations.
|
106 J. Bessard et al. / J. Chromatogr. A 1055 (2004) 99–107 |
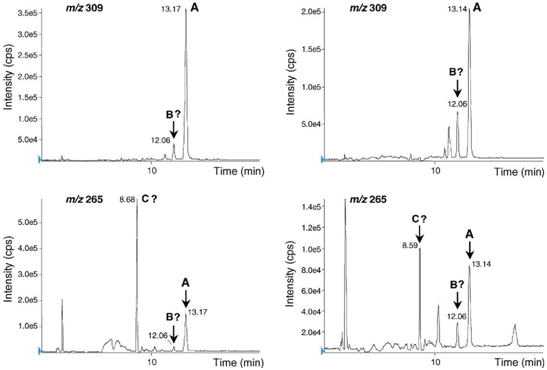
Table 1 presents results of repeated acromelic acid A determinations (intra- and inter-day) from C. amoenolens. Acromelic acid A concentration was measured from C. amoenolens and C. acromelalga at, respectively, 325 and 283 ng/mg dried mushroom (respectively, 14 and 3 determinations). C. acromelalga concentration measured here is higher than literature data [5,6,22]. Yet, we must keep in mind the numerous extraction–purification steps required in previous studies to obtain pure product from large quantity of fresh or frozen mushrooms.
3.8. Research of other acromelic acids in C. amoenolens and C. acromelalga
C. acromelalga is known to contain four other acromelic acids mainly acromelic acid B, a position isomer of acromelic acid A, and acromelic acid C (molecular weight 266) corresponding to a decarboxylation of acromelic acid B on the pyridone ring (Fig. 1).
Both on C. acromelalga and C. amoenolens extracts (Fig. 6), the LC–ESI-MS–SIM chromatograms showed at RT 12.06 min a peak m/z 309 that eluted before the acromelic acid A. Their corresponding negative ESI mass spectrum was similar to the one of acromelic acid A, suggesting the presence of acromelic acid B. Furthermore, at RT 8.6 min (Fig. 6), the peak m/z 265 had a corresponding negative ESI mass spectrum characterised by a strong molecular peak at m/z 265. This last product (molecular weight 266) could be explained by the presence of acromelic acid C. As acromelic acids B and C were not commercially available, it was not possible to ascertain their identification. However, the LC–MS findings were corroborated by GC–MS analysis of derivatized Clitocybe extracts (data not shown).4. Conclusion
LC–MS allowed us to identify and measure the acromelic acid A, a powerful neurotoxic amino acid, in C. amoenolens, a mushroom recently classified as poisonous.
However, the question remains to know whether or not erythermalgia is related to acromelic acids. This reliable analytical method might be a useful tool to analyse various chromatographic fractions of C. amoenolens (or C. acromelalga) during their neurophysiological and toxicological evaluation.
Furthermore, this method requires only a few milligrams of mushroom and might be helpful in other species analysis, in particular for scarce species.
Acknowledgements
We would like to thank Doctor K. Konno and Professor K. Yokoyama for their generous donation of synthetic acromelic acid A, S. Miyauchi and D. Guez for providing Clitocybe acromelalga and P.-A. Moreau for mushroom identification. We are indebted to Réseau Rhône-Alpes Auvergne de Toxicovigilance for its financial support.
|
J. Bessard et al. / J. Chromatogr. A 1055 (2004) 99–107 107 |
References
[1] P.-A. Moreau, R. Courtecuisse, D. Guez, R. Garcin, P. Neville, P. Saviuc, Cryptogamie Mycol. 22 (2001) 1.
[2] P. Saviuc, V. Danel, P.-A. Moreau, D. Guez, A. Claustre, P.H. Carpentier, J. Toxicol. Clin. Toxicol. 39 (2001) 403.
[3] K. Nakamura, F. Shoyama, J. Toyama, K. Tateishi, Jpn. J. Toxicol. 0 (1987) 35.
[4] D. Guez, Bull. Fed. Mycol. Dauphiné-Savoie 16 (1990) 12.
[5] K. Konno, K. Hashimoto, Y. Ohfune, H. Shirahama, T. Matsumoto, J. Am. Chem. Soc. 110 (1988) 4807.
[6] S. Fushiya, S. Sato, T. Kazasawa, G. Kusano, S. Nozoe, Tetrahedron Lett. 31 (1990) 3901.
[7] S. Fushiya, S. Sato, Y. Kera, S. Nozoe, Heterocycles 34 (1992) 1277.
[8] S. Kwak, R. Nakamura, Brain Res. 702 (1995) 61.
[9] K. Konno, K. Hashimoto, Y. Ohfune, H. Shirahama, T. Matsumoto, Tetrahedron Lett. 27 (1986) 607.
[10] K. Hashimoto, K. Konno, H. Shirahama, T. Matsumato, Chem. Lett. (1986) 1399.
[11] J.E. Baldwin, C.S. Li, J. Chem. Soc. Chem. Commun. (1988) 261.
[12] M. Horikawa, K. Hashimoto, H. Shirahama, Tetrahedron Lett. 34 (1993) 331.
[13] J.E. Baldwin, A.M. Fryer, G.J. Pritchard, M.R. Spyvee, R.C. Whitehead, M.E. Wood, Tetrahedron Lett. 39 (1998) 707.
[14] J.E. Baldwin, A.M. Fryer, G.J. Pritchard, M.R. Spyvee, R.C. Whitehead, M.E. Wood, Tetrahedron 54 (1998) 7465.
[15] M.A. Quilliam, B.A. Thomson, G.J. Scott, K.W.M. Siu, Rapid. Commun. Mass Spectrom. 3 (1989) 145.
[16] J.F. Lawrence, B.P.Y. Lau, C. Cleroux, D. Lewis, J. Chromatogr. A 659 (1994) 119.
[17] M.A. Quilliam, P.G. Sim, A.W. McCulloch, A.G. McInnes, Int. J. Environ. Anal. Chem. 36 (1989) 139.
[18] M.A. Quilliam, M. Xie, W.R. Hardstaff, J. Assoc. Off. Anal. Chem. 78 (1995) 543.
[19] P. Ross, R.E. Majors, LC–GC Eur. 13 (2000) 310.
[20] R. Causon, J. Chromatogr. B 689 (1997) 175.
[21] V.P. Shah, K.K. Midha, J.W. Findlay, H.M. Hill, J.D. Hulse, I.J. McGilveray, Pharm. Res. 17 (2000) 1551.
[22] K. Konno, H. Shirahama, T. Matsumoto, Tetrahedron Lett. 24 (1983) 939.
/http%3A%2F%2Fstorage.canalblog.com%2F15%2F47%2F1309869%2F104420640_o.jpg)
/http%3A%2F%2Fstorage.canalblog.com%2F90%2F48%2F1309869%2F113945017_o.jpg)
/http%3A%2F%2Fstorage.canalblog.com%2F53%2F66%2F1309869%2F121351886_o.jpg)